Building End-to-End Diagnostics: Visualization with Exporters

Posts in this series:
- An Intro
- Trace Context
- Diagnostic Events
- OpenTelemetry Integration
- Activity and Span Correlation
- Visualization with Exporters
- User-Defined Context with Correlation Context
- ActivitySource and OpenTelemetry 1.0
In the last post, we looked at surfacing our diagnostics events from the Activity and DiagnosticSource APIs on through to OpenTelemetry Spans.
Side note - the .NET team is working to close the gap between the OTel "Span" concept and the Activity API. The end goal is that the Activity class represents an OTel "Span".
With all of these pieces in place, we can now export these traces to...well, something! The benefit of this common OTel API means that it should be much easier to export your traces to some collector that can then store, index, and visualize your traces. But before we look at visualization, let's build a couple of complex but contrived scenarios for a more real-world scenario distributed system.
Orchestration Sample
I wanted to try to use as many different distributed components as possible that I typically see in my client work, in an arrangement of different conversation patterns, so I wanted an example system that did:
- Request/Response with HTTP
- Request/Response with AMQP
- Pub/Sub with AMQP
- Orchestration and Choreography with AMQP
- Database interaction with SQL and MongoDB
There's probably someone winning a distributed systems bingo at this point. My sample application will have 3 different endpoints:
- Web Application (receives the first request)
- Worker Application (Worker SDK)
- Child Worker Application (another Worker SDK)
Because I'm lazy, I'll kick things off with the Swagger UI, and initiate 2 kinds of interactions:
- Process manager using orchestration
- Process manager using choreography
First, let's look at an orchestration conversation:
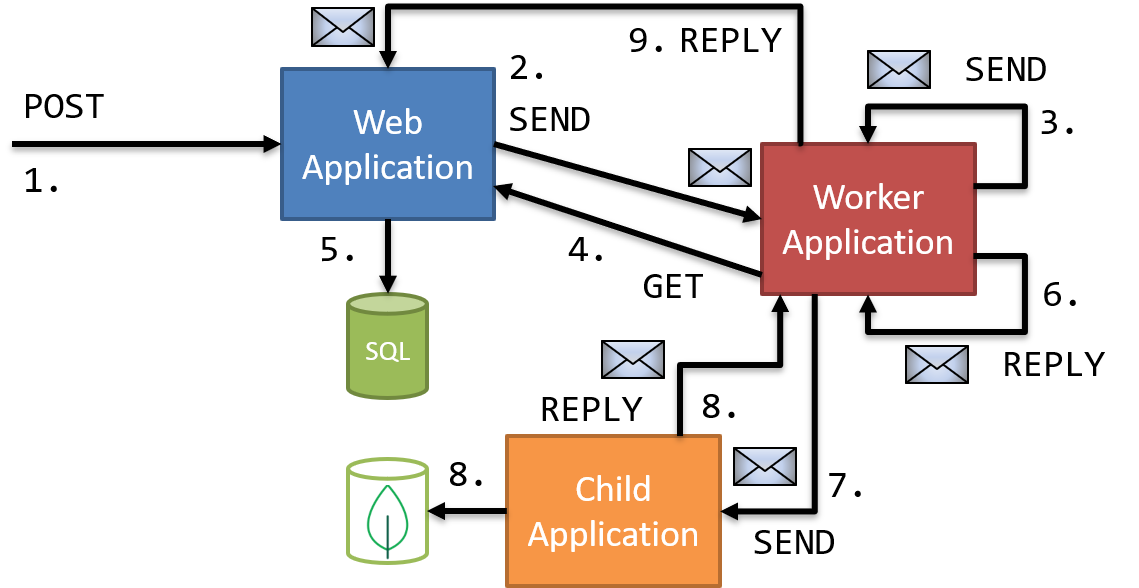
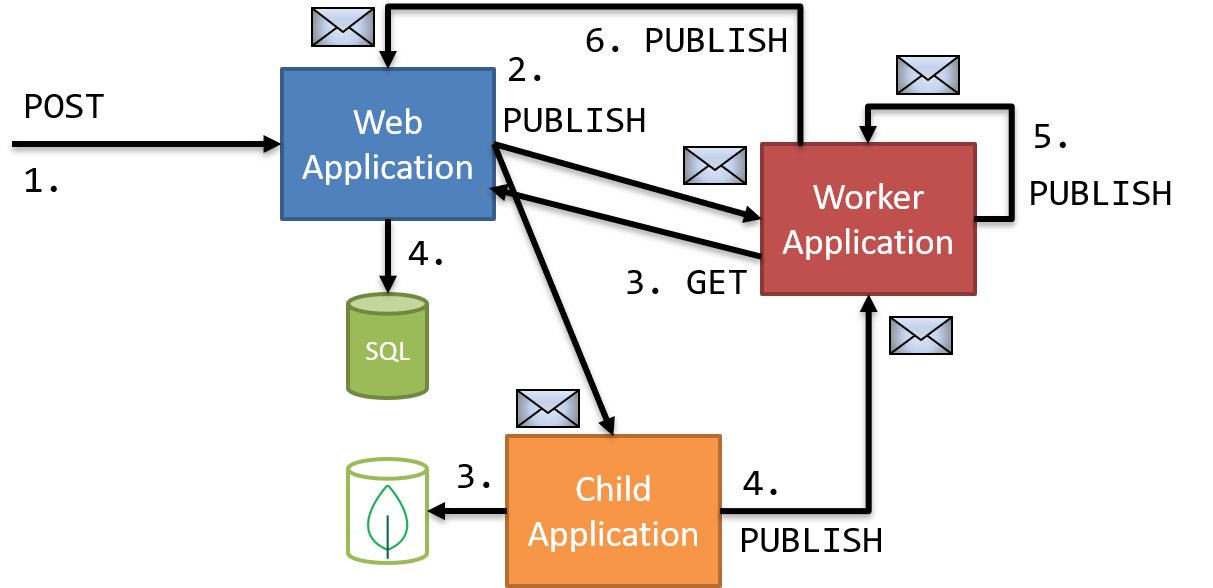
The code is a bit much, but let's walk through the interactions:
- HTTP POST to Web Application
- AMQP Send to Worker Application
- Worker Application receives message and starts process manager; AMQP Send to itself
- Worker Application receives message, makes HTTP POST to Web Application
- Web Application makes SQL call
- Worker Application receives HTTP reply, makes AMQP Reply
- Worker Application process manager receives reply, makes AMQP Send to Child Application
- Child Application receives message, makes MongoDB call and makes AMQP Reply to Worker Application
- Worker Application process manager receives reply, marks process as complete and makes AMQP Reply to process manager initiator
- Web Application receives message and conversation completes
WHEW. Now this conversation does resemble ones I've built, but it is a bit contrived as I don't usually have these back-and-forth communications. But it does show the different kinds of communications in a complex conversation.
If something were to go awry in this conversation, we wouldn't have much recourse to fix anything without distributed tracing.
Exporting Traces with OpenTelemetry
Configuring our applications to export their traces and spans is easy, first we add the appropriate exporter packages:
<PackageReference Include="OpenTelemetry.Exporter.Jaeger" Version="0.2.0-alpha.283" />
<PackageReference Include="OpenTelemetry.Exporter.Zipkin" Version="0.2.0-alpha.283" />
Once we have our packages referenced, we can configure them with the rest of our OpenTelemetry setup:
services.AddOpenTelemetry(builder => builder
    .UseZipkin(o =>
    {
        o.Endpoint = new Uri("http://localhost:9411/api/v2/spans");
        o.ServiceName = Program.EndpointName;
    })
    .UseJaeger(c =>
    {
        c.AgentHost = "localhost";
        c.AgentPort = 6831;
        c.ServiceName = Program.EndpointName;
    })
    .AddNServiceBusAdapter()
    .AddRequestAdapter()
    .AddDependencyAdapter(configureSqlAdapterOptions:
        opt => opt.CaptureTextCommandContent = true));
Each call to an exporter needs some configuration on how to connect to it. Zipkin and Jaeger will need a URI, while Application Insights would need our instrumentation key.
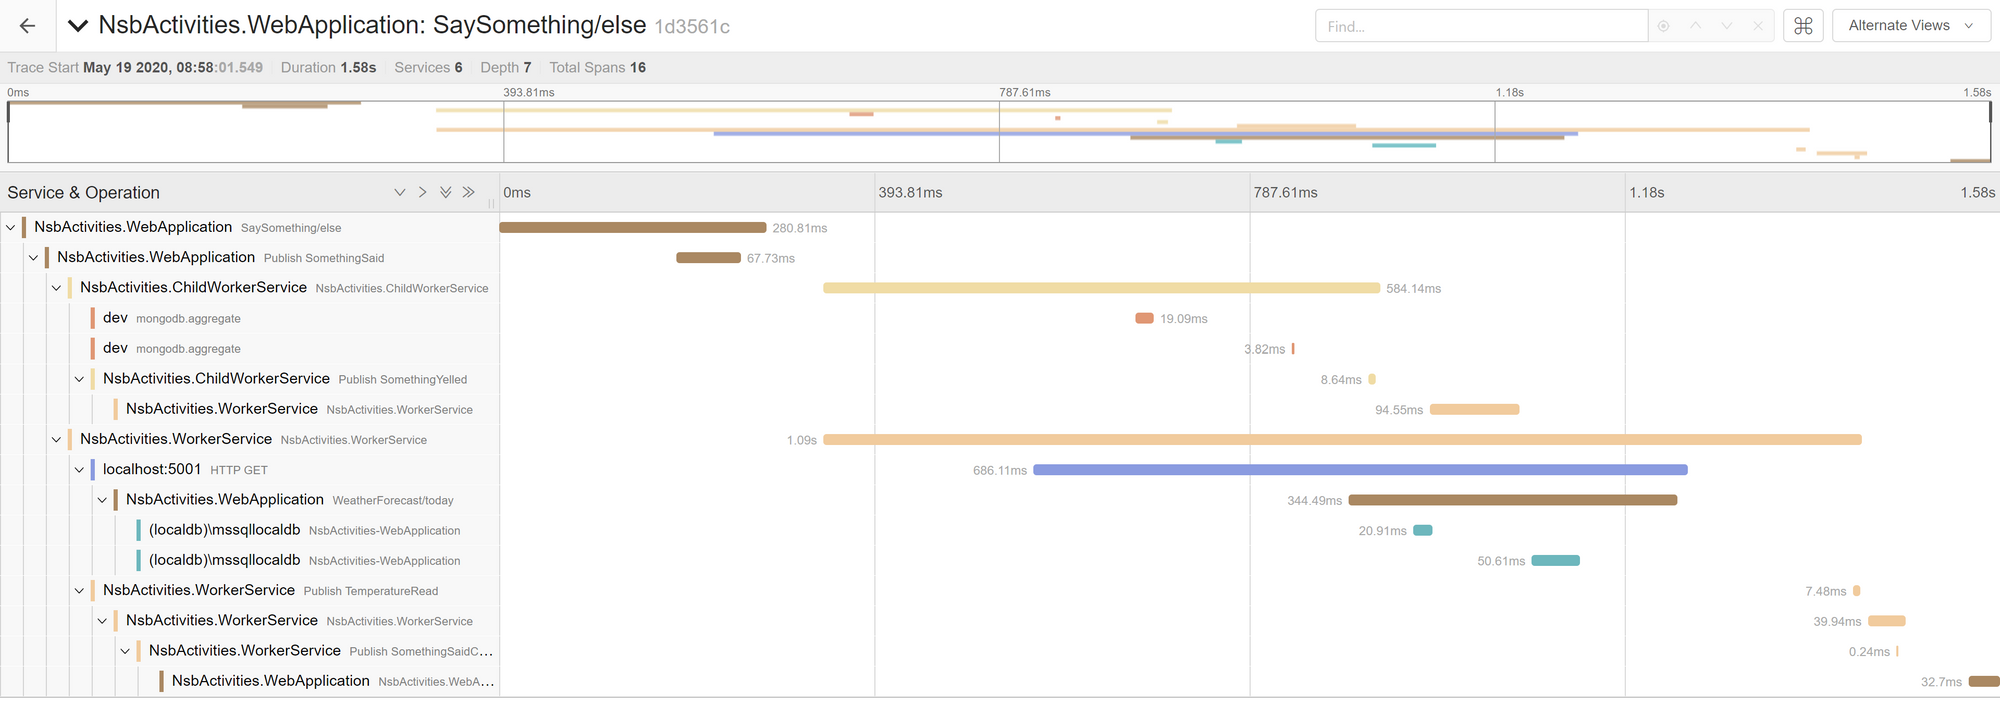
That's it! Once we've configured our exporters, our application will export them seamlessly as it handles requests. Let's look at traces for our orchestration-style communication (and we should see all the steps above), first in Zipkin:
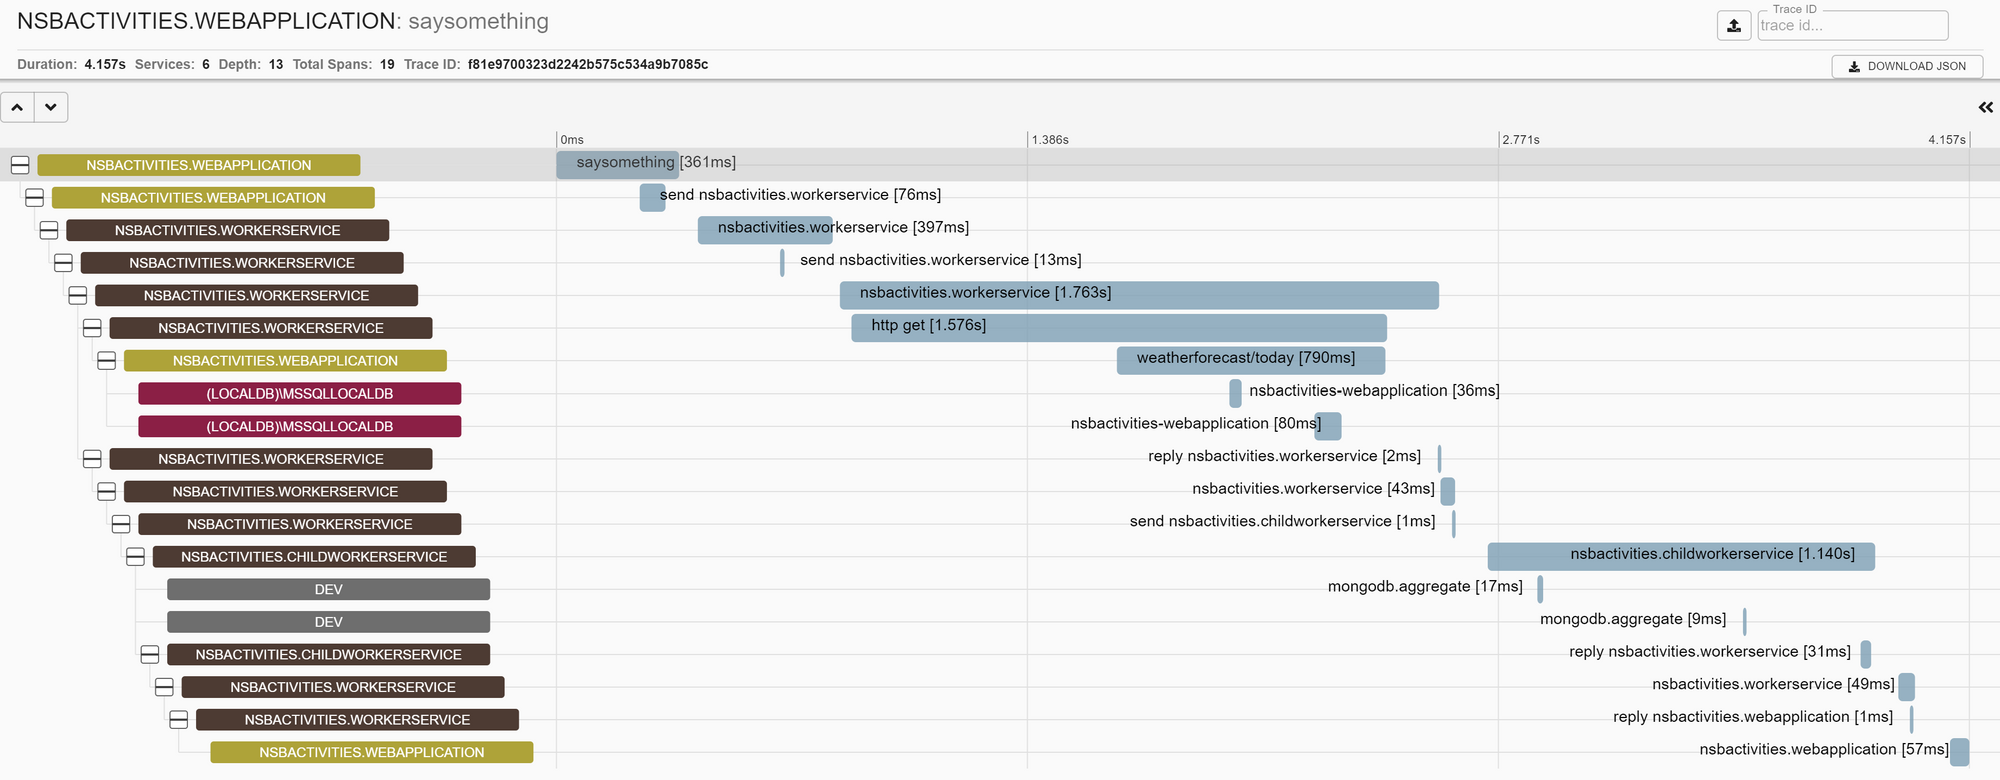
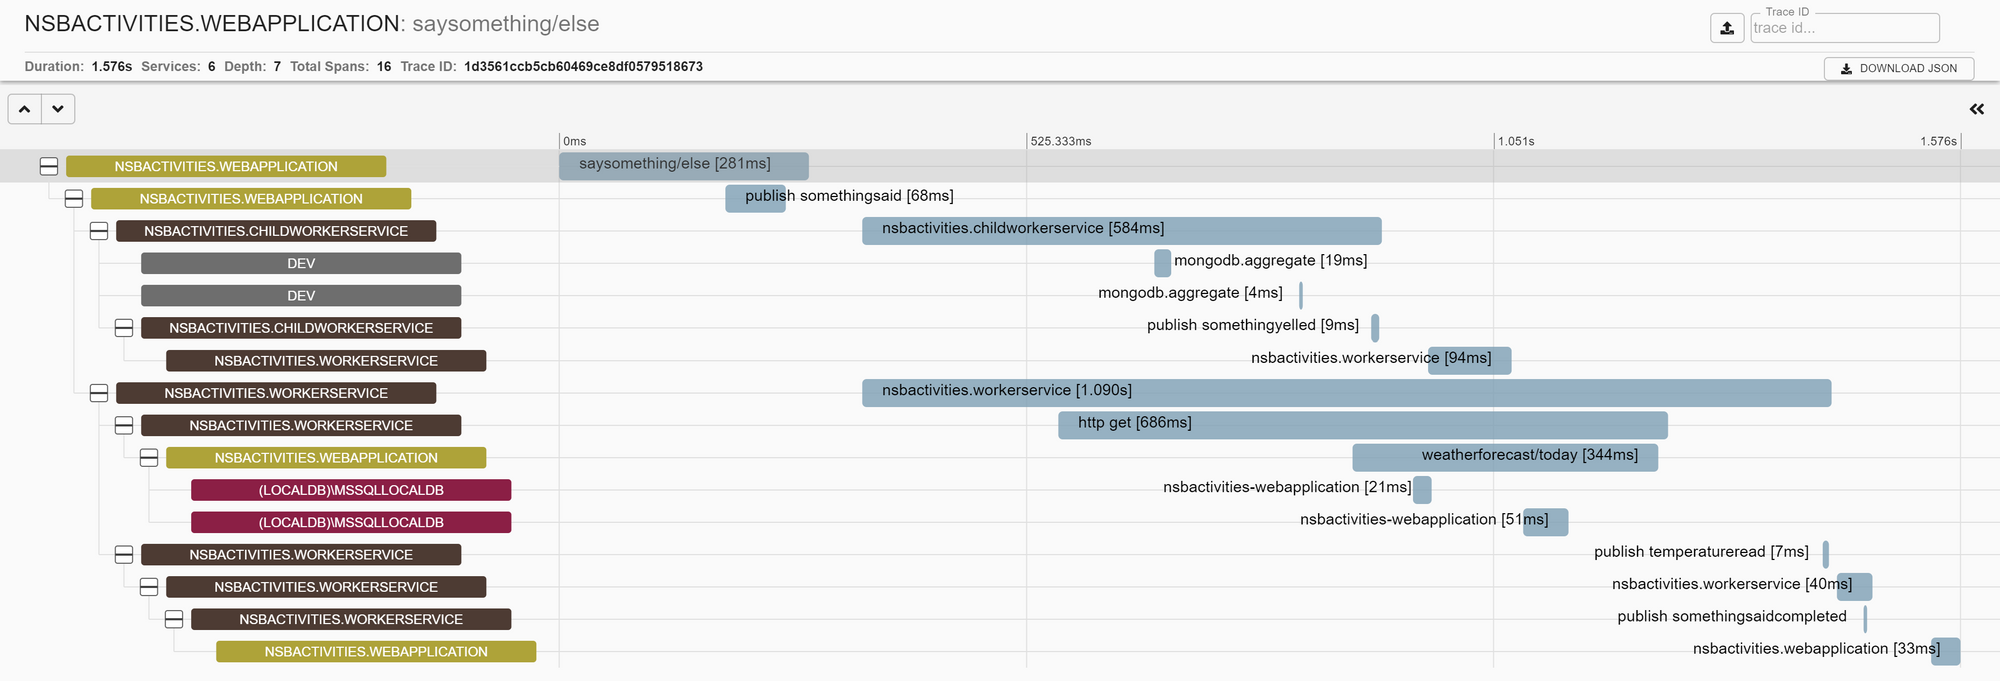
And next in Jaeger:
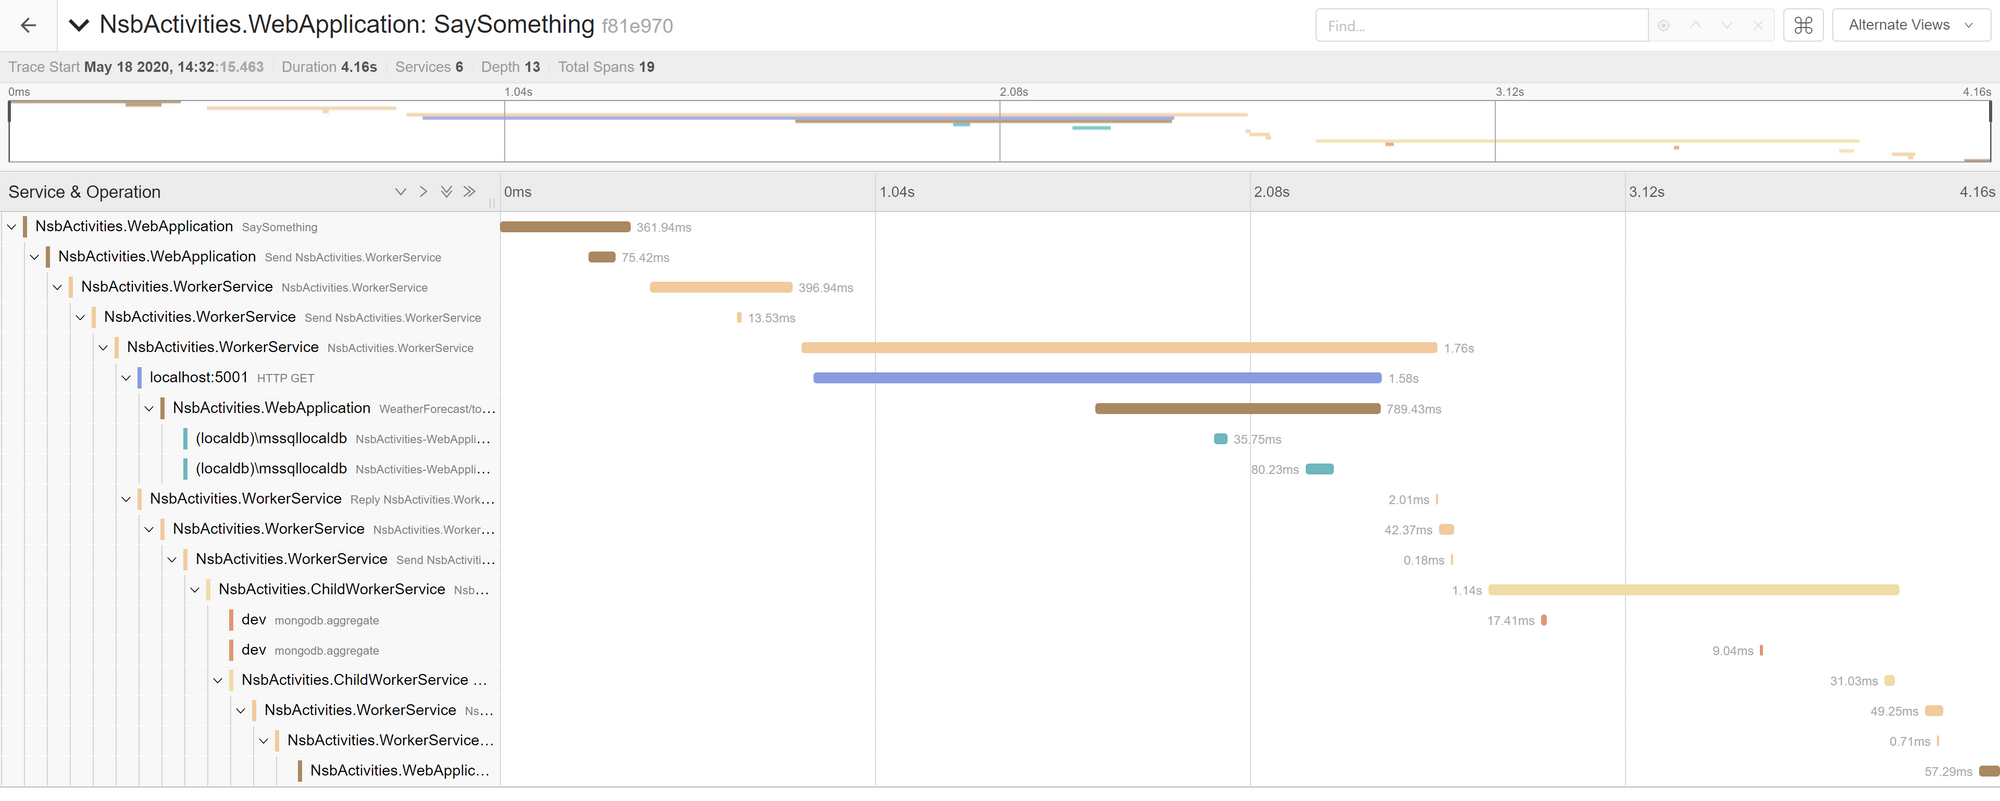
In each of these traces, we can follow the conversation all the way from the initial HTTP POST all the way down to the final AMQP "reply" back to the process manager originator. And because this is an orchestration-style process, the execution times are completely linear - no process hands off to another until it completes.
Without our integration into NServiceBus, we wouldn't have this connected conversation - only disconnected individual traces for each HTTP request. With OpenTelemetry, we've got a complete view of our entire conversation, with each step recorded along the way.
Let's contrast this with a choreography-style conversation to see how that might look.
Choreography Sample
In our orchestration sample, we used commands and replies to dictate a flow for our conversation. With choreography, our communication is more event-oriented, and multiple steps can execute in parallel. Our choreography conversation looks like:
This conversation is a bit different than the orchestration conversation because we're using events, rather than commands, to coordinate an activity. This allows some processes to execute in parallel. The worker application and child application now handle the published event simultaneously, and publish an event when their step completes.
Finally, our process manager subscribes to the "complete" event from both processes, and when both events are received, the process manager publishes its final event back to the Web Application.
We can see that there are fewer messages in this approach, as each application uses an event to fire, as opposed to the two messages involved in request/response. With our choreography application set up, let's look to see how this conversation manifests in Zipkin:
And in Jaeger:
In each of these traces, we see the interaction kick off with the Web Application publishing an event. Next, both the Child Worker Service and Worker Service execute in parallel, making requests and doing work. We also see the Child Worker Service publishing an event to the Worker Service process manager, but it is not until the second event that the process manager receives that the final publish and receive from the Web Application happens.
Looking at each of these traces, we can see how the conversation patterns differ in their communication style and processing.
With OpenTelemetry, we've made it simple to add end-to-end distributed tracing to our system. None of our application code is aware of OpenTelemetry even existing, and with the upcoming changes to the Activity API, adding distributed tracing will be made even easier.
In the next (and last) post, I'll share some future direction of OpenTelemetry, as well as links to the sample extensions made into released NuGet packages.