
Building NServiceBus Metrics with OpenTelemetry and System.Diagnostics.Metrics

The release of System.Diagnostics.DiagnosticSource version 6.0 a few months back brought something entirely new to the library - support for OpenTelemetry Metrics. Since this package releases out-of-band from the .NET 6 SDK, it also means you can use these new metrics APIs in any application targeting .NET 4.6.1 and above, .NET Standard 2.0 and above, and .NET 5/6. I wanted to try this new API out with NServiceBus metrics, to see how easy it was to bridge their metrics with the OpenTelemetry ones. Spoiler alert - very easy.
Ideally, libraries that have existing metrics support through the older APIs or custom APIs convert to the OpenTelemetry versions, but until then, we can simply bridge the exposed metrics over. Luckily, the NServiceBus docs already detail bridging these metrics over to Prometheus and Grafana.
Bridging to System.Diagnostics.Metrics
Metrics in the System.Diagnostics.Metrics API, unlike the System.Diagnostics.DiagnosticSource API, is a brand new API that matches the OpenTelemetry definitions and API. This makes it a bit easier to read the OpenTelemetry docs and understand the concepts across platforms - the names and APIs are (largely) the same. The Metrics API Design proposal provides a great overview of how these concepts line up.
In our application code, we:
- Define a Meter, giving it a unique name and instantiate it once
- Create Instruments corresponding to the equivalent NServiceBus metrics
- Record Measurements
- Collect Measurements (using a
MeterListeneror an OpenTelemetry exporter)
First, we define an NServiceBus Feature that represents collecting our metrics and create our Meter:
public class DiagnosticsMetricsFeature : Feature
{
    private static readonly AssemblyName AssemblyName
        = typeof(DiagnosticsMetricsFeature).Assembly.GetName();
    private static readonly string InstrumentationName
        = AssemblyName.Name;
    private static readonly string InstrumentationVersion
        = AssemblyName.Version.ToString();
    private static readonly Meter NServiceBusMeter
        = new(InstrumentationName, InstrumentationVersion);
We'll give the name and version for our meter the same name and version of our assembly, which should guarantee uniqueness in a consumer.
Next, we'll need to define our instruments. There's a few out there, but we need to line them up with the ones defined in NServiceBus.Metrics. In that library, there are two types of "probes":
- Signal
- Duration
These correspond roughly to the OpenTelemetry instruments of:
- Counter
- Histogram
Technically the Duration probe doesn't have to be a Histogram, a Gauge could fit too but I'll keep with a Histogram for now. The metrics we're then mapping over are:
| NServiceBus Probe Name | Instrument Name | Instrumentation Type |
|---|---|---|
# of msgs successfully processed / sec |
messaging.successes |
Counter<long> |
# of msgs pulled from the input queue /sec |
messaging.fetches |
Counter<long> |
# of msgs failures / sec |
messaging.failures |
Counter<long> |
Retries |
messaging.retries |
Counter<long> |
Critical Time |
messaging.client_server.duration |
Histogram<double> |
Processing Time |
messaging.server.duration |
Histogram<double> |
I've named the instruments according to the OpenTelemetry semantic conventions. Next, we create these counters based on their types:
private static readonly Counter<long> SuccessTotalCounter =
    NServiceBusMeter.CreateCounter<long>("messaging.successes");
private static readonly Counter<long> FetchedTotalCounter =
    NServiceBusMeter.CreateCounter<long>("messaging.fetches");
private static readonly Counter<long> FailureTotalCounter =
    NServiceBusMeter.CreateCounter<long>("messaging.failures");
private static readonly Histogram<double> CriticalTimeSecondsHistogram =
    NServiceBusMeter.CreateHistogram<double>("messaging.client_server.duration", "ms");
private static readonly Histogram<double> ProcessingTimeSecondsHistogram =
    NServiceBusMeter.CreateHistogram<double>("messaging.server.duration", "ms");
private static readonly Counter<long> RetriesTotalCounter =
    NServiceBusMeter.CreateCounter<long>("messaging.retries");
When we receive NServiceBus metrics to set up, they'll have special names, so we'll need to map the NServiceBus metrics names to our instruments:
private static Dictionary<string, Counter<long>> SignalMapping = new()
{
    { "# of msgs successfully processed / sec", SuccessTotalCounter },
    { "# of msgs pulled from the input queue /sec", FetchedTotalCounter },
    { "# of msgs failures / sec", FailureTotalCounter },
    { "Retries", RetriesTotalCounter },
};
private static Dictionary<string, Histogram<double>> DurationMapping = new()
{
    { "Critical Time", CriticalTimeSecondsHistogram },
    { "Processing Time", ProcessingTimeSecondsHistogram },
};
In our Feature constructor, we'll turn on Metrics and grab the MetricsOptions object for later setup:
public DiagnosticsMetricsFeature()
{
    Defaults(settings =>
    {
        _metricsOptions = settings.EnableMetrics();
    });
}
To register our integration with NServiceBus, we need to use the RegisterObservers method, grabbing some context for some environmental attributes:
protected override void Setup(FeatureConfigurationContext context)
{
    var settings = context.Settings;

    var logicalAddress = settings.LogicalAddress();
    var discriminator = logicalAddress.EndpointInstance.Discriminator ?? "none";

    var transportDefinition = settings.Get<TransportDefinition>();

    _metricsOptions?.RegisterObservers(
        register: probeContext =>
        {
            var messagingSystem = transportDefinition.GetType().Name.Replace("Transport", null);

            RegisterProbes(probeContext, new[]
            {
                new KeyValuePair<string, object?>("messaging.system", messagingSystem.ToLowerInvariant()),
                new KeyValuePair<string, object?>("messaging.destination", settings.LocalAddress()),
                new KeyValuePair<string, object?>("messaging.destination.endpoint", settings.EndpointName()),
                new KeyValuePair<string, object?>("messaging.destination.discriminator", discriminator),
                new KeyValuePair<string, object?>("net.host.name", Dns.GetHostName()),
                new KeyValuePair<string, object?>("net.host.ip", IpAddressResolver.Value)
            });
        });
}
Different frameworks have different mechanisms for registering custom instrumentation, this mechanism is specific to NServiceBus.
Next, we define our RegisterProbes method:
private void RegisterProbes(ProbeContext context,
    KeyValuePair<string, object?>[] tags)
{
Then we register our callbacks to record our histogram:
foreach (var duration in context.Durations)
{
    if (!DurationMapping.ContainsKey(duration.Name))
    {
        continue;
    }
    var histogram = DurationMapping[duration.Name];

    duration.Register((ref DurationEvent @event)
        => histogram.Record(@event.Duration.TotalMilliseconds, tags));
}
For each IDurationProbe, we look up the corresponding Histogram, and register a callback. Each time the probe triggers a callback, we record the event value in our histogram with the corresponding Duration value, plus the tags we passed in earlier. We need to make sure we record the same unit that we configured in our Instrument - ms so we choose TotalMilliseconds.
There's not a perfect instrument for lead time - a Gauge is likely closer but OpenTelemetry treats this as an observable metric, like temperature etc. that always has some value and gets observed at some interval.
Next, we register our callbacks for Signals:
foreach (var signal in context.Signals)
{
    if (!SignalMapping.ContainsKey(signal.Name))
    {
        continue;
    }
    var counter = SignalMapping[signal.Name];

    signal.Register((ref SignalEvent @event) => counter.Add(1, tags));
}
With a Counter, we simply call Add.
Finally, we can enable our feature in our NServiceBus configuration:
endpointConfiguration.EnableFeature<DiagnosticsMetricsFeature>();With this hooked up, we can focus on collecting our metrics with OpenTelemetry.
Collecting metrics with OpenTelemetry
Similar to tracing, we'll need to explicitly enable instrumentation based on the different sources we care about. We'll also need to export our metrics to...whatever we want to export them to! In my case, I'll choose Prometheus, but you could choose Grafana etc.
We'll first need to register our instrumentation and exporters:
services.AddOpenTelemetryMetrics(builder =>
{
    builder
        .SetResourceBuilder(resourceBuilder)
        .AddAspNetCoreInstrumentation()
        .AddMeter("NServiceBusDiagnosticsDemo")
        .AddPrometheusExporter(options =>
        {
            options.ScrapeResponseCacheDurationMilliseconds = 1000;
        });
});
We add our Meter based on the name, which from earlier, was simply the assembly name. Next, we register our Prometheus meter provider (exporter). And since Prometheus uses a scraper to pull metrics, we'll need to add that to our app as well:
app.UseSwaggerUI(c =>
{
    c.SwaggerEndpoint("/swagger/v1/swagger.json", "WebApplication API V1");
});

app.UseOpenTelemetryPrometheusScrapingEndpoint();

app.UseHttpsRedirection();
With this in place, we can point a local Prometheus instance at our app to get metrics for our application, such as our critical time metric:
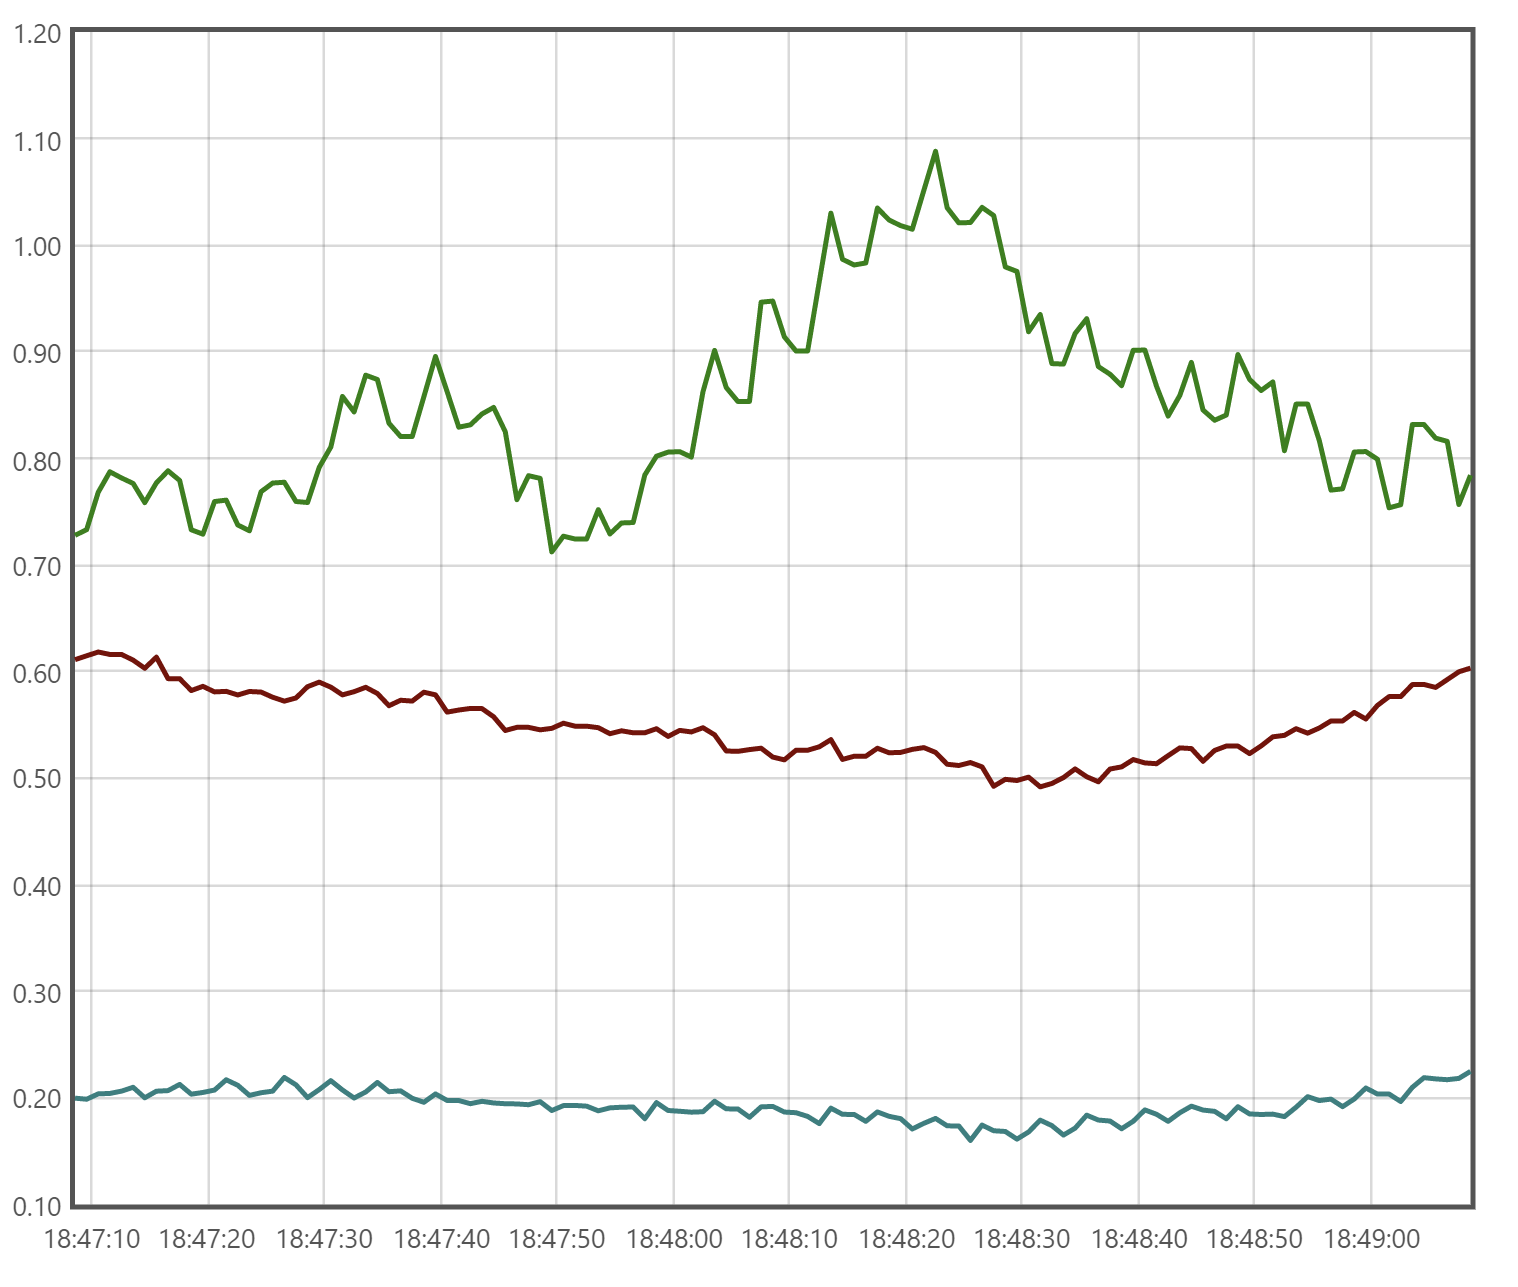
What's nice about all this is my application code doesn't need to export to Prometheus directly, but just use the standard OpenTelemetry APIs exposed in the System.Diagnostics.DiagnosticSource package and my metrics can be exposed to any of the platforms that support the standard (or that have an exporter defined). And since this is a new API, it directly implements the OpenTelemetry standard, no translations needed.